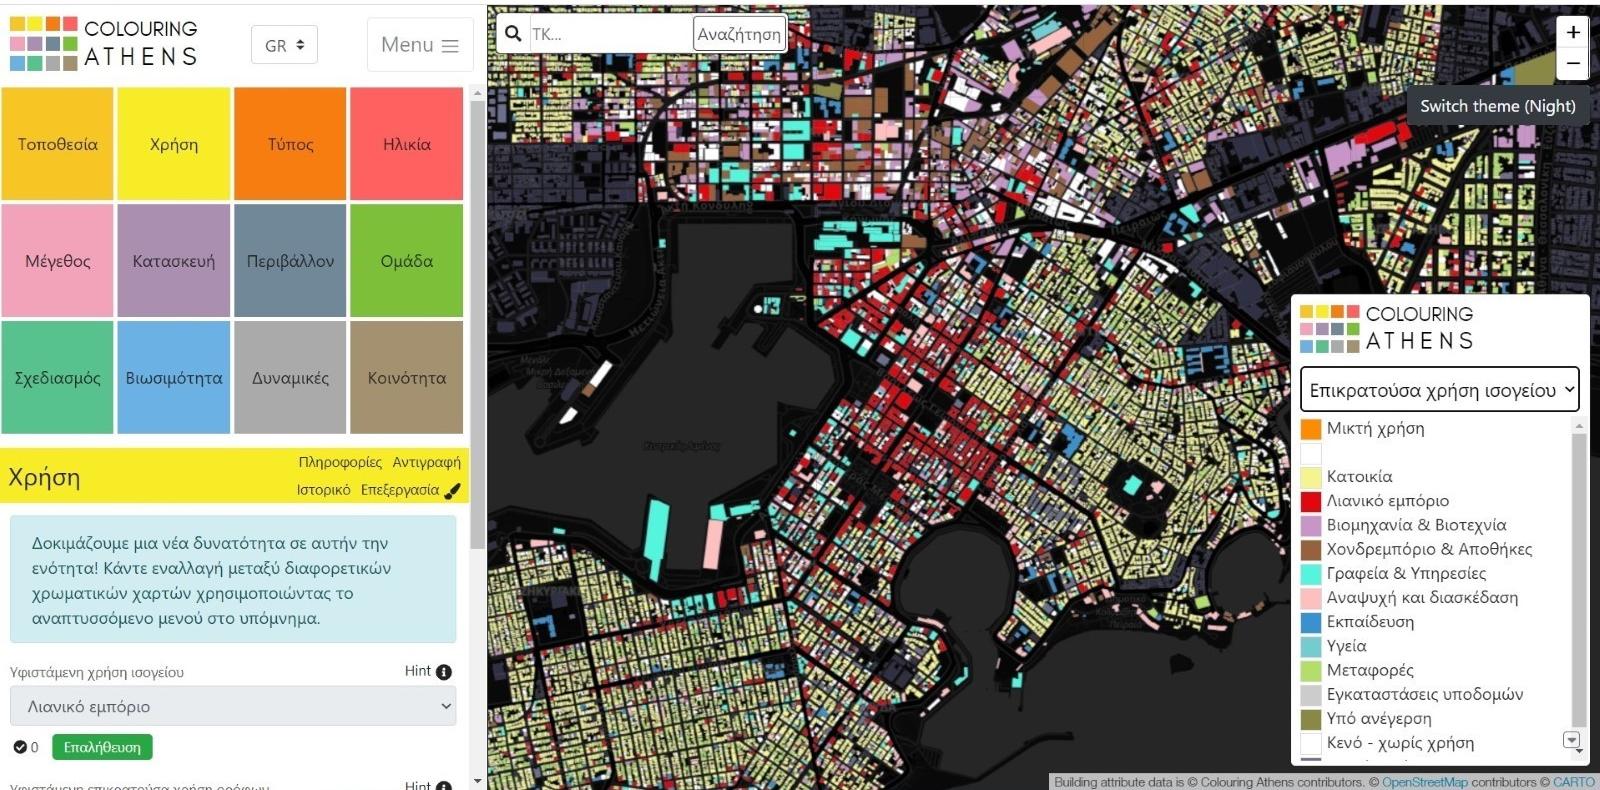
What is Colouring Athens?
Colouring Athens is a free knowledge exchange platform, designed to collate, collect, generate, visualise, open spatial data on every building in Athens. It also releases open platform code, to enable its design to be easily reproduced.
If you live in, research into, design, build, manage, care for, or just love Athens’ buildings, this platform has been designed to help you share your knowledge to make the city more sustainable. We're looking for volunteers of all ages and abilities, and contributors from academia, government, industry and the voluntary sector, to help colour-in the city's buildings, to create beautiful, informative, and accurate maps.
The platform is developed by the Urban Planning Research Lab of the School of Architecture and the Geochoros Geospatial Analysis and GIS Research Group of the School of Rural, Surveying and Geoinformatics Engineering of the National Technical University of Athens. It is funded by the Athens Development and Destination Management Agency and is developed based on the open Colouring Cities code that was initially developed for the city of London. Colouring Athens is part of the international Colouring Cities Research Programme run by The Alan Turing Institute, the United Kingdom's national institute for data science and artificial intelligence.
How do you use our site?
You can simply view our maps, or sign-up and help us develop our open database - when you add information the buildings will colour!
You can download our data for free, use our open platform code and feedback on new features or changes you would like to see. You can also help us by sending links to datasets of relevance, and by checking our data too.
 View or add data now
What are we collecting?
Our platform collects data on the physical form, quality and performance of Athens’ buildings, and their lifespans and history.
Over the next several years our goal, with your help, is to provide free spatial statistics on the location, use, age, size, street context, designers/ builders, planning status, sustainable performance, repairability, and site history of all buildings in Athens.
Where's the building?
Current Use
Form & Original Use
Date built
Dimensions
Methods & Materials
Plot, Street, Greenery
Creators & Awards
Controls
Performance & Maintenance
Lifespan & History
Works well locally?
How are we collecting data?
We are currently testing four methods of data capture: bulk upload of existing open datasets; crowdsourcing at building level; automated approaches (e.g. inferring roof shape from building age and height data); and live streaming (particularly of planning data). Data ethics, including issues relating to privacy and potential negative applications, and data accuracy, are key areas of research.
Colouring Cities Research Programme
The Colouring Cities Research Programme (CCRP) has been set-up to help accelerate knowledge exchange on stock sustainability, across cities and countries. The collective aim of academic partners is to co-develop prototype platform code to increase open data necessary to support the United Nations New Urban Agenda. The CCRP currently works with research institutions in Lebanon, Bahrain, Australia, Greece, Germany, Switzerland, China and Athens, as well as the UK.
 Find out more
Why is this project needed?
The building stock makes up most of a city's fabric, and is a society's most important physical resource. The quality of our buildings, and the streets they form, and particularly of our homes which comprise the vast majority of buildings, will have a profound effect on the quality of our lives. However geospatial data on buildings, required to measure and improve quality and performance in the stock, continue to be highly fragmented, and are difficult to access in Greece and in many other countries.
Buildings and building construction are responsible for around 40% of global energy use, and 24% of global material extraction from the lithosphere. Tightening of international energy and waste legislation since the 1990s has led to a major shift in Europe, from a focus mainly on new buildings to the stock as a whole and the need to reduce energy and waste flows, and increase resilience within it. Tracking the demolition and retrofit of buildings, which are complex finite resources, and measuring the scale of material extraction and energy and waste flows generated through churn in the stock are now of increasing concern.
This has created an urgent demand from scientists for more detailed data on the characteristics of buildings for analysis, monitoring, and for simulations and forecasting models. Though large-scale building attribute datasets are being released in some countries, in Greece, attribute data remain heavily restricted even for academic research.
Colouring Athens/London and the Colouring Cities Research Programme have been set up in response to this situation, and test a new type of open knowledge exchange platform. This centres around an open database designed to collate, capture, generate and drive the release of open building attribute data, and to provide open platform code facilitating platform reproduction. The key aim of the CCRP is to work across countries to support the objectives of the United Nations 2016 New Urban Agenda and its goal to promote the development of sustainable, inclusive, healthy and resilient cities and stocks.
What kind of questions are we trying to answer?
Colouring Athens has been designed to explore how high quality open data on stocks can be made available as quickly, efficiently and cheaply as possible, to improve the sustainability, resilience and quality of national building stocks and to support the UN New Urban Agenda. The Colouring Cities Research Programme looks at how prototype design can be enhanced through international research collaborations, and made easy to copy.
The platform looks at ways in which to collect data on the composition, quality, performance, and dynamic behaviour of the building stock. Specific questions include: What are the size, age, form, and use of buildings? Where are different types of buildings located? Which are the most resilient/long lasting and adaptable and why? What types do citizens think work best? And how can we best reuse and retrofit these valuable, complex resources so as to reduce urban resource wastage and support global sustainable development goals?
What kinds of data are being collected?
We're collecting twelve main types of data, shown below, and over fifty types of data subcategories though we don't visualise them all. You can find out more about them here.
Where's the building?
Current Use
Form & Original Use
Date built
Dimensions
Methods & Materials
Plot, Street, Greenery
Creators & Awards
Controls
Performance & Maintenance
Lifespan & History
Works well locally?
All data we collect about buildings and homes is free for others to use e.g. relating to location/address, use, age, size, construction materials, design team, energy performance ratings, site history, planning status, and whether citizens think the building contributes to the city as a whole, and whether it is publicly/community owned.
Datasets such as those providing preservation status are already released by government as open data. We do not collect personal data, other than email addresses (so that you can reset your password if you wish), nor data relating to the interior of homes (as for example shown on property websites) as we consider this to be private space, though we do collect data on the interior of public buildings.
We have grouped types of data we think we need to collect into twelve categories to keep things simple.
The first seven categories (up to Streetscape) provide information on the characteristics of buildings, and their physical context and use. 'Team' explores methods of, both, collecting data on who built and designed a building, and of enabling quality of construction industry output to be tracked against industry awards, energy performance data and user feedback on quality. 'Planning' provides the opportunity to view the preservation status of buildings. 'Sustainability' allows for the value of new data categories such as 'degree of maintenance'. 'Dynamics' looks at new ways to generate lifespan data for use in the assessment of stock vulnerability and typology survival rates. And 'Community' allows statistical data on how well residents think a building works to be gathered, and for loss of buildings, typologies and uses considered of value to the local community to be tracked.
We are grateful to the many expert bodies that have advised us during Colouring Athens' first stage from NGO’s and government departments, to industry experts and research institutions. Additions and alterations to the initial design will occur as the live prototype testing project evolves and we are always keen to hear of other types of building attribute data that may be of use. We are currently improving our feedback mechanisms.
Where does the data come from?
Our database is being produced by testing, for the moment, four different approaches to data capture. First is the collation of existing open spatial datasets on buildings, which in Greece are rare. This is also done to demonstrate to government departments the critical importance of a data collation and a concerted effort towards open data release, to improve efficiency within the stock, assist in urban problem solving and support Greece’s transition to a low carbon economy.
The second approach tested is crowdsourcing, as used by other open knowledge platforms such as OpenStreetMap and Wikipedia. This requires interface features to be designed with different audiences to facilitate expert input from citizens, who actually use buildings and know how well they work for users, to experts researching into, designing, building, monitoring, protecting and managing them. The platform also tests new types of features including the Dynamics tool used to facilitate transformation of historical information, by historians, into spatial statistics for use by scientists in forecasting models, evolution animations and planning simulations.
The third approach is to apply computational approaches to existing attribute data, to generate new large-scale datasets. The accuracy of generated attributes can then be verified by experts through the crowdsourcing process, allowing for the development of feedback loops between crowdsourcing and computational methods.
We will also be testing the live streaming of planning data to create a visual traffic light system. The aim is to provide a real time visual overview of change occurring in the city, and to help citizens, local authorities and developers communicate better in relation to the long-term benefits, socio-cultural, environmental and economic, of proposed schemes.
Who is it designed for?
Colouring Athens is designed for anyone interested in finding out about and/or constructively sharing knowledge on Athens' buildings. This includes residents, local authorities, local planning groups, and housing and construction industry professionals involved in the design, repair, construction, conservation and management of the city's buildings. The platform is also designed for use in education and research, by schools, universities, policy makers and community groups, as well as by individual citizens. Anyone can also view, add to, and download our data from anywhere in the world.
Our open code is designed to stimulate experimentation and innovation in open platform design and data collection relating to the building stock. The Colouring Cities Research Programme (CCRP) has also been set up to help international research institutions, involved in sustainable city research, build and test their own research-led national, regional or city focused platforms.
Who is it built & managed by?
Colouring Athens is developed and managed by the Urban Planning Research Lab of the School of Architecture and the Geochoros Geospatial Analysis and GIS Research Group of the School of Rural, Surveying and Geoinformatics Engineering of the National Technical University of Athens. Colouring Athens was based on the prototype and open code of Colouring London and is part of the Colouring Cities Research Programme (CCRP) run by The Alan Turing Institute (ATI), the UK's national institute for data science and artificial intelligence, which is based in the British Library, London. Colouring Cities Research Programme run by The Alan Turing Institute , the UK's national institute for data science and artificial intelligence, which is based in the British Library, London.
Colouring London was developed at Centre for Advanced Spatial Analysis, University College London, in 2014 as part of a four year research study funded by the UK's Engineering and Physical Sciences Research Council (EPSRC). Historic England, Ordnance Survey and The Greater London Authority have been core partners since 2016. Platform design has also been informed by input from many partners - working in urban science, energy, architecture, architectural history, planning, sustainable heritage, building technology, public education, communications, community planning and open data - as well as by UK and international research groups, and by individual Colouring London contributors and its team.
In 2020 Colouring London moved to the Alan Turing Institute, where the CCRP was set up as a mechanism to support research-led prototype reproduction and to meet growing interest from international research institutions. It is run by a small multidisciplinary team that brings together expertise from the arts, humanities and science (on buildings, urban heritage, open software development, collaborative maintenance systems, free knowledge exchange tools relating to the building stock, energy and graphic design).
Who's funding and supporting it?
Colouring Athens is funded and supported by the Athens Development and Destination Management Agency. It is also supported by the Colouring Cities Research Programme team which is based at the Alan Turing Institute. Colouring London's initial development, at UCL, was made possible through an Engineering and Physical Sciences Research Council grant (EPSRC, DTG) provided by the Bartlett Centre for Advanced Spatial Analysis, and by the first of two grants from Historic England's Heritage Protection Commission. The project has also received funding from the MacArthur Foundation, UCL Innovation and Business, Innovate UK and the Geospatial Commission. In addition it has been offered significant help-in-kind by UCL, the Alan Turing Institute, Ordnance Survey and Historic England, as well as free advice and input from many other project partners, for which we are extremely grateful.
How do I find your ethics policy?
Consideration of data ethics issues is undertaken with regard to all aspects of platform design and content, at the earliest design stage. Issues are also reassessed on an ongoing basis to see how the platform's usefulness in providing open data for the public good can be improved, and how security, privacy, transparency and interoperability and accessibility can all be increased. The Colouring Cities Research Programme supports the:
- The Open Data Charter, signed up to by all G8 countries and over 150 governments and organisations.
- The Open Data Institute's Principles for strengthening our data infrastructure and its Openness principles for handling personal data.
- The Centre for Digital Built Britain's Gemini Principles designed as a 'conscience' for built environment information management systems, and national digital twin.
- The United Nations New Urban Agenda, signed up to by 167 countries, to advance sustainability development goals for cities and their communities.
Further information is available on our Data Ethics page.
Can anyone add, edit & use the data?
We're hoping to involve as many audience groups as possible in the process of creating and updating beautiful, informative maps. Colouring Athens' maps can be seen as series of giant jigsaw puzzles, designed to help solve certain types of problem, where, by colouring-in building footprints with information on building i.e. on their form and use, on how well they work and how they fast they change, contributors can help reveal patterns in the data, and insights into the stock as a dynamic system, never seen before.
If you want to edit data you just need to be over 13 to sign up or, if you're younger, to have a parent or guardian do this for you. Every entry is valuable to us, however we are looking for data that's as accurate as possible. Our easiest category to add to is the 'Community' section' which includes questions on how well you think different types of building work. We've included this both to capture information on building quality and performance, and to encourage residents and schools to join in.
If you're a resident the easiest way you can help us is by just adding information on the physical characteristics of your home or street, and telling us of any buildings you think work well. If you're a civic society, or interested in historical research we'd love your help with our 'Age' and 'Dynamics' categories. If you're a school you could make a huge contribution by adding information on land use and storeys (schools were in fact main contributors to Britain's first land use survey run at the London School of Economics in the 1930s). If you're an architecture student perhaps you could upload relevant statistics from your course work.
If you're a local authority or professional body you can send us bulk uploads for visualisation and verification to support your public facing work. If you're involved in the property and construction industry you can use our free data for your planning context analyses. You can also help by adding information on your past or current developments and by encouraging others in the industry to do the same. This will help lower costs and increase accuracy of context data in future.
We are also working with researchers to test and upload datasets they have produced using computational approaches.
What's the design influenced by?
The design of the Colouring Cities platforms has been inspired by many initiatives but primarily by the Building Exploratory, (designed in the 1990s as a model, for physical centres and Geographic Information Systems (GIS) providing information on the built environment, built by and for communities with academia, government, industry and the third sector); by the open data and open knowledge movement and open databases such as Wikipedia and OpenStreetMap; and by London's tradition of beautiful, informative, maps of the city (see Booth's poverty maps, Goad insurance maps, and the London County Council's World War 11 bomb damage maps on which buildings are coloured at building or block level.
Other influences include Citizen Science projects such as Galaxy Zoo; English Heritage's Historic Landscape Characterisation programme (from the 1990s); 'Know your place'; IHS's 'Layers of London'; The Survey of London/CASA 'Whitechapel' project; international building data age visualisations using property tax data (from 2013), and by visualisations produced by researchers in Japan, Switzerland, Germany and the UK, illustrating change to stocks over long periods of time.
Many individuals and organisations have helped design and test the platform and we will continue to adjust and improve the platform design and content to try to address user comments needs. If you're working on a similar type of platform anywhere in the world, or using similar categories of data we'd also love to hear from you and to feature your work on our forthcoming 'Data Showcase' page.
Why is colour so important?
Colour is a core feature of the prototype platform Colouring London. It is used to stimulate curiosity, as a thank you to users, and to encourage people to add data to reveal urban patterns never seen before. It is also used to create a relaxing and rewarding experience for data contributors. Our work on colour palettes is at an early stage and we are currently looking at ways to design features of enabling more engagement from artists and designers.
A long tradition of hand-coloured building maps exists in London. The most spectacular examples include the Booth Poverty Map, The LCC Bomb damage maps, The Goad maps and the interwar maps produced by the City of London. Coloured maps showing building characteristics for an entire city or town have until recently been rare, despite their production in Germany and Austria, as part of urban morphology studies, in the first half of the 20th century.
Since 2013, stunning online colour visualisations of property age have been generated for a growing number of cities, as property tax data are released around the world. Created by independent web developers such as Justin Palmer, Thomas Rhiel, Bert Spaan and Brandon Liu, these illustrate the power and beauty of detailed colour-coded data visualisations of the building stock, and the potential to learn from patterns held within them.
Colour-coded visualisations of changes to the physical composition of cities over time, such as those produced in academic studies by Hiroki Tanikawa and Seiji Hashimoto in Japan, are also becoming of increasing importance in scientific research. These are being used to improve understanding of the 'metabolism' of cities and rates of energy and waste flows.
Using colour also helps to firmly demonstrate the importance of working across the arts, humanities and science, in the development of tools designed to aid urban problem-solving and the development of sustainable cities.
Can the platform be copied by other cities?
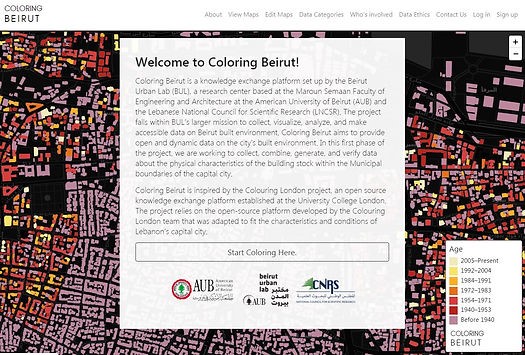
Yes and we encourage it. Any city can use our open platform code available on GitHub as long as they follow the terms of use. Though anyone can experiment and innovate with our code, the Colouring Cities Research Programme (CCRP) has been set-up as a mechanism to support research-led reproduction. This is a branded programme designed to support international research institutions wishing to reproduce the concept and code, and which focuses on UN New Urban Agenda issues. The current CCRP partners are: The American University of Beirut (Colouring Beirut); The University of Bahrain & the Bahrain Authority for Culture and Antiquities (Colouring Bahrain); The University of New South Wales (Colouring Australia); The National Technical University of Athens (Colouring Athens); The Leibniz Institute for Ecological Urban and Regional Development (Colouring Dresden); King’s College London & Institut Teknologi Bandung (Colouring Athens), and The Colour Research Institute, China Academy of Art.
Are you only collecting information on buildings?
Yes, at present, our focus is on the building stock owing to its importance, its complexity and scale, and the current difficulty in many countries in accessing open building attribute data for cities at building level. However we plan over the next year to integrate and layer many other types of infrastructure/environmental data, relating for example to transportation, flood risk, geology, and historical evolution.
How accurate are the data?
Our Data Accuracy Agreement https://Athens.colouringcities.org/data-accuracy.html highlights to users that Colouring London data are gathered from multiple sources and may contain errors. If you can add sources and check our data entries it would greatly appreciated. This is important not only to increase accuracy in the data but also to help users assess reliability, and suitability for specific applications (i.e. for a primary school project or a policy document).
Work on reliability and accuracy, and uncertainty is ongoing and the following features are currently being, or are about to be tested:
- a visible edit history, Like Wikipedia and Open Street Map, Colouring Athens has been designed as collaborative maintenance initiative - though crowdsourcing here is only one of a number of data production methods. This approach allows logged-in users to edit any data entry if they don't agree with it. Visible edit histories are already a standard feature of OSM and allow users to view who last edited data on the building to make a judgement on the reliability of the editor. Editors must sign-up to edit and agree to a code of behaviour. Edit histories also allow quality of data from similar or different sources to be analysed and compared.
- an icon showing the method of data capture e.g a) upload by NTUA of bulk open dataset produced by an expert body, b) crowdsourcing from the community building by building, c) generation using computational methods and inference, d) live streaming, e) other.
- types of source for crowdsourced data e.g. website, book, viewed in situ etc. option to add a weblink to an external source.
- prompt requiring a source to allow data to be saved.
- a verification option that can be ticked, with a single verification permitted per user. confetti burst has been added to help thank editors for checking data.
- Indication of levels of uncertainty e.g earliest or latest possible construction date. Further consultation is known to be required here with experts involved in working with each type of data. .
- Individual colouring of buildings using copy and paste tools, to prevent large areas being highlighted and changed.
- All editors are asked to sign our data ethics agreement to ensure constructive input.
- Updating data to increase accuracy is another important but complex issue. This relies on access to the Hellenic Statistical Authority footprint updates every ten years and OSM updates. This is most relevant to data relating to, for example, land use and planning status, where change is relatively frequent in contrast say to building age, which will only require updating until the building is demolished or a major extension added.
- Feedback loops between automated approaches and expert crowdsourcing are also being tested.
urther information on privacy and moderation are included on our Data Ethics page.
What building outlines do you use & why?;
We are using a hybrid polygon/building footprint basemap that was generated through a combination of OpenStreetMap (OSM) polygons and Hellenic Statistical Authority polygons.
OSM footprints are the most comprehensive, precise, up-to-date footprints available to us. However, they only cover part of the city of Athens. Specifically, after visual inspection it was estimated that OSM currently covers a considerable part of the city, and specifically municipalities located at the center of the city and the eastern, northern and southern suburbs.
The Hellenic Statistical Authority Census 2001 footprints are the only other available source for building footprints. However, these footprints reflect the condition of buildings as it was 20 years ago. Since then, significant modifications have been made to the buildings (demolitions, constructions, additions). As a result, the map does not correspond accurately to the current situation.
The above possibilities and limitations led us to the generation of a hybrid model, based on both building footprints from the 2001 Census and OSM, according to the following methodology. After a visual inspection for each of the 43 Municipalities covered by the project, it was found that the OSM background reflects better the current condition of the buildings for the following 23 central and semi-central Municipalities, including the Municipality of Athens: Agia Paraskevi, Agios Dimitrios, Athens, Alimos, Maroussi, Vrilissia, Vyronas, Galatsi, Glyfada, Dafni – Ymittos, Elliniko – Argyroupoli, Zografou, Ilioupoli, Kaisariani, Kallithea, Moschato – Tavros, Nea Ionia, Nea Smyrni, Palaio Faliro,Papagou – Cholargos, Philadelphia – Chalcedon, Filothei – Psychiko and Chalandri. The Census 2001 background was used for the remaining following 20 Municipalities where the OSM cartographic background is still insufficient: Ilio, Agia Varvara, Agioi Anargyroi – Kamatero, Aigaleo, Vari - Voula – Vouliagmeni, Heraklion, Keratsini – Drapetsona, Kifissia, Korydallos, Lykovrysi – Pefki, Metamorphosi, Nikaia - Agios Ioannis Rentis, Piraeus, Penteli, Perama, Peristeri, Petroupoli, Chaidari, Acharnes and Fili.
The final building footprint basemap consists of 292,579 Hellenic Statistical Authority Census 2001 buildings and 234,853 OSM buildings. In total we have a background of 527,432 buildings. For those buildings derived from OSM users will be able to download data in the form of a shapefile, under the ODBl license, while for buildings derived from the Hellenic Statistical Authority users will be able to download only images. In case that a new building footprint basemap is generated during Census 2021, the information will be transferable to the new polygons.
Furthermore, rapid progress in improving global scale of footprint coverage is being made through Microsoft/Bing’s collaboration with OSM, and the application of artificial intelligence to satellite imagery, to generate open footprints. This has so far produced open footprint datasets for the US, Canada, Uganda and Australia, which are being integrated by OSM, alongside open street-network and international national mapping agency data (where available) as well as other types of open, crowdsourced geoinformation.
The OSM/Microsoft partnership is extremely important in that it means that footprints are likely to become increasingly available at global scale (with the quality of these able to be improved through parallel release by national mapping agencies), opening up offering opportunities for scientific analysis of diverse types of building attribute data at global scale.
Why can't I add text?
Colouring Athens is a statistical database, set up in large part to help increase scientific analysis of the building stock. We collate, collect, visualise and generate spatial statistics. Our categories use dropdown menus and avoid freetext boxes wherever possible to maximise site security, though weblinks can be added to relevant website pages. For further information please see our Data Ethics page.